Estimated Average Glucose Explained Clearly
Estimated average glucose, almost always shortened to eAG, restates an A1C percentage in the same units a home meter displays. It is not a separate test, it needs no extra blood, and it costs nothing to produce. It is a translation, and understanding how that translation works makes both numbers considerably easier to live with.
Where the formula came from
In 2008 a large international study followed volunteers who wore continuous glucose monitors while having their A1C measured repeatedly over several months. Comparing the two data sets produced a straight line relationship between the percentage and the average glucose those monitors recorded. That relationship has been used ever since.
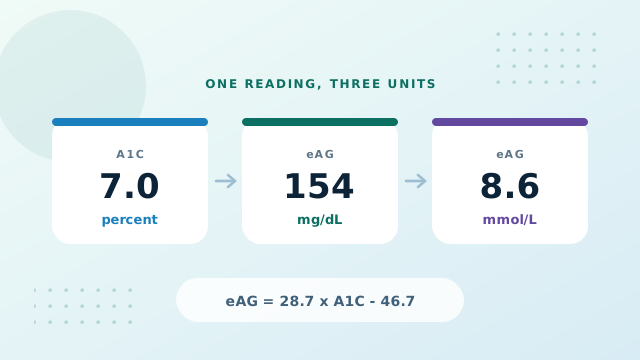
eAG in mg/dL equals 28.7 multiplied by your A1C, minus 46.7. To reach millimoles per liter, divide that answer by eighteen.
An A1C of 7.0 percent therefore converts to roughly 154 mg/dL, which is about 8.6 mmol/L. Every figure the calculator produces comes from this same relationship, carried at full precision internally and rounded only at the moment it appears on screen.
Working the arithmetic by hand
If you want to check a figure yourself, the order matters. Multiply first, then subtract.
- Start with the percentage. Take 7.4 as an example.
- Multiply by 28.7. That gives 212.38.
- Subtract 46.7. That leaves 165.68, which displays as 166 mg/dL.
- Divide by eighteen for millimoles. That gives 9.2 mmol/L.
Why two glucose units exist at all
Different countries settled on different conventions and never converged. Milligrams per deciliter is standard across the United States and several other regions. Millimoles per liter is used through most of Europe, Australia, Canada and much of Asia.
Neither is more accurate than the other. They count the same substance on different scales, and moving between them is only ever a matter of multiplying or dividing by eighteen. The table below shows how the same handful of results appear in each system.
| A1C | eAG mg/dL | eAG mmol/L | Reference band |
|---|---|---|---|
| 5.0% | 97 | 5.4 | Below 5.7% |
| 5.7% | 117 | 6.5 | 5.7% to 6.4% |
| 6.5% | 140 | 7.8 | 6.5% and above |
| 7.0% | 154 | 8.6 | 6.5% and above |
| 8.0% | 183 | 10.2 | 6.5% and above |
| 9.0% | 212 | 11.8 | 6.5% and above |
If you read health information published in several countries, or you moved between them, seeing all three figures side by side removes a genuine and very common source of confusion. That is the main reason the calculator always returns the complete set rather than only the unit you typed. The full conversion chart extends this table across the whole supported range.
The word estimated is doing real work
The formula describes an average drawn from a large group of people. Your own body may sit slightly above or below that line for reasons that have nothing whatsoever to do with how carefully anything is being managed.
Red blood cell lifespan is the clearest example. The relationship assumes cells survive a fairly typical length of time. Someone whose cells last a little longer accumulates more glucose coating and reads slightly higher. Someone whose cells turn over faster reads slightly lower. Both people might have identical average glucose.
So treat eAG as a helpful translation rather than a measurement. It answers the question of roughly what average your A1C corresponds to. It does not claim to be the average your meter would have recorded had you tested continuously. Our guide on factors that shift a result covers every situation where this gap widens.
The conversion runs both ways
Nothing about the relationship is one directional. If you know an average glucose figure, the same line tells you which A1C it corresponds to. That matters in two practical situations.
- Your report lists an average rather than a percentage. Some laboratories print eAG directly, particularly in regions that favour millimoles.
- You want to compare a meter average against a lab result. Converting one of them puts both on the same scale so the comparison is meaningful.
The calculator accepts any of the three units as input and fills in the other two automatically, so you never need to rearrange the formula or worry about which direction you are working in.
How to actually use the number
The practical value of eAG is comparison. It lets you hold a laboratory result next to the figures you see every day and judge whether the two broadly agree.
Broad agreement is what you should expect, not an exact match. A meter average built mostly from readings before meals will usually sit below the converted figure, because it under samples the hours after eating. That is normal and predictable rather than a problem.
A wide and persistent gap is different, and it is worth raising with your clinician. Several recognised conditions pull the two measurements apart, and identifying which one applies changes how the result should be read. Our guide to factors affecting A1C goes through these situations in detail.
One misreading worth avoiding
An A1C of 7.0 does not mean a blood glucose of seven anything. In millimoles it corresponds to about 8.6, and in milligrams to about 154. Treating the percentage as though it were already a glucose value is the single most common mistake people make with these numbers, and converting removes the risk entirely.
Conclusion: Estimated Average Glucose
eAG is your A1C spoken in meter language. One published straight line relationship connects them, it works in both directions, and it holds across all three units. Read the converted figure as a close approximation rather than a measurement, expect broad agreement with your own readings rather than an exact match, and treat a large persistent gap as something to mention rather than something to explain away.
Enter a reading and all three units appear together, along with the reference band it falls in.